Reading a chart
Two timeframes
The higher chart names the condition. The lower chart is where you look for the invalidation.
Lesson 2 of 4 • 11 min
Worked example
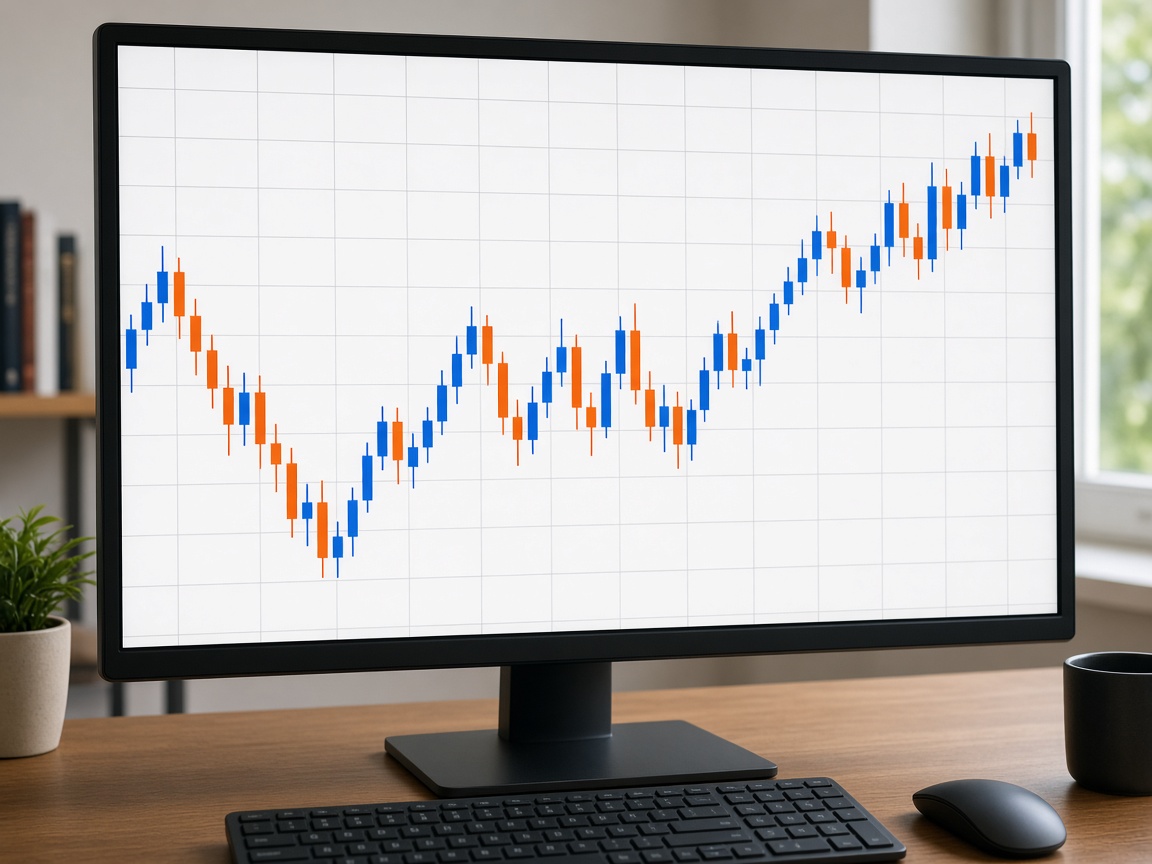
Study material only. It is not a signal to buy or sell. AcademyTrade is education. It is not a broker, not investment advice, and not a promise that you will make money. Trading can lose the money you deposit.
A daily chart and a 15-minute chart are two pictures of the same meetings. They disagree often. The daily can be rising while the last hour is falling. That is not a contradiction. It is two distances.
Use the higher timeframe to name the condition: rising, falling, or ranging. Use the lower timeframe to find the place where that idea would be wrong, and to see whether anyone is actually trading there. If you start from the lower chart, every wiggle looks like a decision.
Two is enough. A stack of six charts is a way to keep searching until you find the picture you already wanted. Write both timeframes on the plan before the session, and do not add a third because the first two were inconvenient.
The higher chart does not owe you a trade. If it says the condition is unclear, the lower chart does not get to overrule it.
- Choose the pair of timeframes before you open the platform.
- Name the condition on the higher one.
- Mark the invalidation on the lower one.